Growth plan for Ugmonk, 2 Oct 2026
Scale spend. Hold CAC.
Ugmonk has 50,000+ people using the Analog Card System and 4.9 Based on 61 Reviews on one page. The plan scales ad spend only while CAC holds at R$ 18.72, and tests creative first on the Daily Focus Kit and journals.
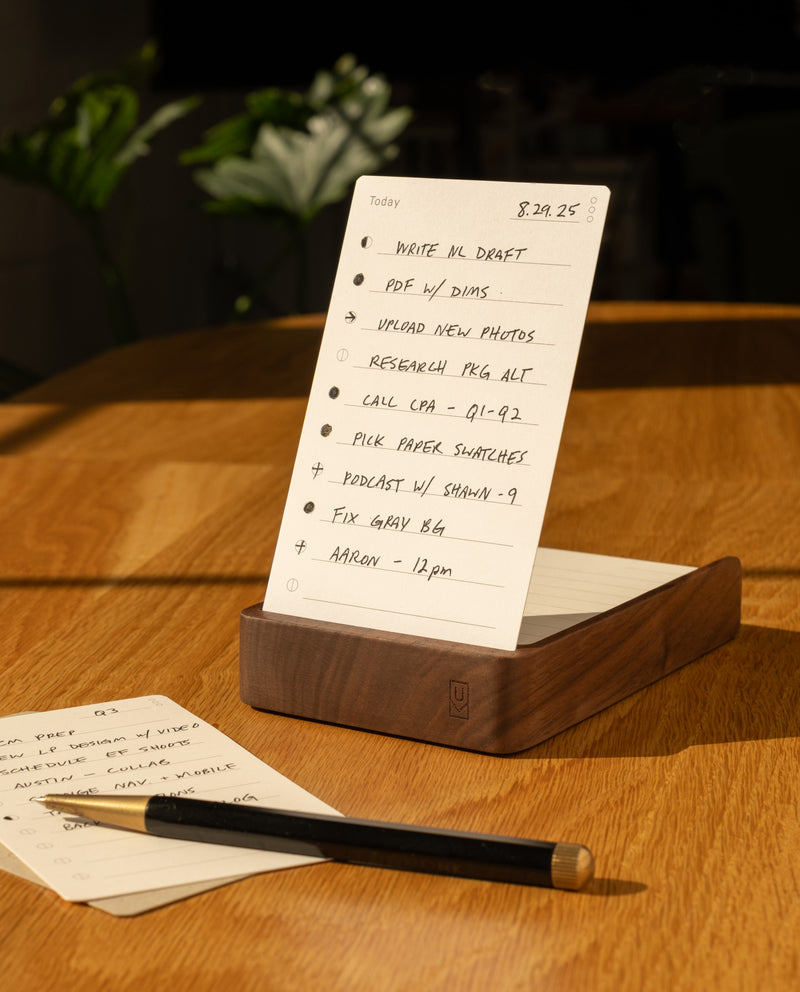
- Target CAC
- R$ 18.72
- New ads a week at peak
- 20
- Creators live by week six
- 10
- Test spend, six weeks
- R$ 24,000
Contents
10 chapters, then the gates and every number’s source.
01 The number
One number to protect: R$ 18.72 CAC on a Daily Focus Kit order
The number is target CAC: R$ 18.72. It is 0.6 of a R$ 31.20 ceiling, built from a R$ 39 average order, 40% margin and one repeat order. Those inputs are my guesses until Ugmonk's own data replaces them in week one.
Protect
Target CAC: R$ 18.72 on a first purchase
Ceiling = average order × margin × (1 + repeat orders): R$ 39 × 40% × (1 + 1) = R$ 31.20. Guard line = 0.6 × R$ 31.20 = R$ 18.72. Across the ranges: R$ 3.65 to R$ 606.15.
Three moves
- Kill losing ads early so spend flows to concepts that hold CAC at R$ 18.72.
- Test one variable per ad, starting with the Analog Daily Focus Kit and the journal bundles.
- Report daily CAC and monthly cohort payback so nothing drifts unseen.
- people use the Analog Card System
- 50,000+
- Published
- reviews behind a 4.9 rating on one page
- 61
- Published
- year Ugmonk began designing in Pennsylvania
- 2008
- Published
02 Variety
Cards, journals, hourglasses: each ad carries one product
Each ad concept has to carry one reason to buy: the Analog Card System, the Daily Focus Kit's month of task cards, or the Discbound Heirloom Journal's leather and brass. Hook, product and proof change one at a time so we learn what moved.
| Reason to buy | Proof you already have | Ads (proposed) |
|---|---|---|
| Tools for focused work | Ugmonk designs analog tools for focused, intentional work. | 8 |
| The best-selling card system | The best-selling Analog Card System is used by 50,000+ people worldwide. | 3 |
| Buy once, refill for life | Buy it once. Refill it for life. | 2 |
| Bundle savings | Save $30 with this Bundle | 2 |
| Designed in Pennsylvania | Designed in Pennsylvania since 2008. | 1 |
| Rated by buyers | 4.9 Based on 61 Reviews | 1 |
| Free US shipping | 100% Satisfaction Guarantee | Free US Shipping | 1 |
| Total | The ad concepts tab | 18 |

Each row is a reason to buy that the brand already has proof for. The count is how many of the ads carry it: a reason with a single ad is a bet, not a pattern, and the next batch of concepts moves toward the reasons that win.
03 Disturbances
Seven risks, from Warehouse no-returns to thin reviews
| Disturbance | Likelihood | Impact | Owner | Gate (proposed) |
|---|---|---|---|---|
| Warehouse items can't be returned, so ads sending buyers there could raise complaints | Med | Med | Your team | Warehouse items stay out of paid traffic until return wording sits beside the buy button. |
| Reviews are thin on most pages: 2 reviews and 8 reviews appear next to 61 reviews | High | Med | Your team | Every ad landing page carries a review count before spend rises past the first two test weeks. |
| Shipping wording varies: Free US Shipping and Free US Shipping R$ 200+ both appear | Med | Med | Your team | One shipping line, confirmed by Ugmonk, is used in every ad before launch. |
| Creative fatigue: ads wear out if new concepts stop arriving each week | Med | High | Me | Hook library refreshed weekly; any ad whose CAC drifts above R$ 31.20 is retired. |
| Average order may sit below my R$ 39 guess, which shrinks the ceiling | Med | High | Both | Week one replaces R$ 39 with the real average order; ceiling recalculated before the next test batch. |
| Purchase events miss repeat orders, so payback reads wrong | Med | High | Your team | Events specced and tested with your team before any week-three spend. |
| Creator clips drift from the product, such as the Today Cards, and fail the hook test | Low | Med | Me | Each creator's first video is reviewed against the claims sheet before it runs as an ad. |
Scores are my read from outside the company, re-scored in week one with your data. Each risk has one owner and one gate that can be checked with a number, so nobody has to argue about whether it happened.
04 The ceiling
The ceiling is R$ 31.20; the guard line is R$ 18.72
| Line | Value | Status |
|---|---|---|
| Average order | R$ 39 (range R$ 6.95–R$ 449.00) | Assumption Range from the site product prices (Published); the midpoint is a guess |
| Gross margin | 40% (range 35–45%) | Assumption Replace in week one |
| Repeat orders after the first | 1 (range 0.5–2) | Assumption Replace with cohort data in week one |
| Margin per customer, all orders | R$ 31.20 | Calculated Average order × margin × (1 + repeat orders) |
| Guard line for CAC | R$ 18.72 | Calculated 0.6 × the margin per customer |
The math, with the assumed lines
Ceiling = average order × margin × (1 + repeat orders): R$ 39 × 40% × (1 + 1) = R$ 31.20. Guard line = 0.6 × R$ 31.20 = R$ 18.72. Across the ranges: R$ 3.65 to R$ 606.15.
Range across the assumptions: R$ 4 to R$ 606.
The R$ 31.20 ceiling uses a R$ 39 order, 40% margin and one repeat order: all guesses of mine. Only the 0.6 guard line, R$ 18.72, is arithmetic. Week one swaps in Ugmonk's real order data.
The ceiling is a range, not one number: the most a new customer can cost before shipping and packaging, which I do not have. Replace the guessed lines with yours and every figure below recalculates.
05 Test ramp
R$ 24,000 of tests over six weeks before any scale
| Week | New ads × budget / ad (proposed) | Weekly test spend | Cumulative | Creators posting | CAC target (proposed) |
|---|---|---|---|---|---|
| 1 | 12 × R$ 250 | R$ 3,000 | R$ 3,000 | 0 | R$ 19 |
| 2 | 12 × R$ 250 | R$ 3,000 | R$ 6,000 | 2 | R$ 19 |
| 3 | 12–20 × R$ 250 | R$ 4,000 | R$ 10,000 | 4 | R$ 19 |
| 4 | 12–20 × R$ 250 | R$ 4,000 | R$ 14,000 | 6 | R$ 19 |
| 5 | 20 × R$ 250 | R$ 5,000 | R$ 19,000 | 8 | R$ 19 |
| 6 | 20 × R$ 250 | R$ 5,000 | R$ 24,000 | 10 | R$ 19 |
Six weeks, R$ 24,000 of tests, all Proposed. Weeks one and two run 12 ads at R$ 250 each, R$ 3,000 a week. Weeks three and four run 12–20 ads, R$ 4,000 a week. Weeks five and six run 20 ads, R$ 5,000 a week. Losers die early.
The math. Week 1: 12 × R$ 250 = R$ 3,000; Week 2: 12 × R$ 250 = R$ 3,000; Week 3: 16 × R$ 250 = R$ 4,000; Week 4: 16 × R$ 250 = R$ 4,000; Week 5: 20 × R$ 250 = R$ 5,000; Week 6: 20 × R$ 250 = R$ 5,000. Total R$ 24,000 (96 ads × R$ 250). A range such as 12–20 counts as its midpoint.
Weeks one and two test what the brand already has, rewritten per reason to buy. From week three, creator videos enter paid only after they beat their own account median. A range of new ads counts as its midpoint in the spend column.
06 Volume
More concepts, more winners: 20 concepts up to 80
More concepts mean more winners. At 20 concepts the Assumption is 2 winners; at 80, 8. Each winner adds R$ 18,000 in monthly spend, so R$ 72,000 at 80 concepts. Hit rate and spend per winner are Assumptions.
| Concepts tested / month | Hit rate (assumed) | New winners / month | Spend each winner holds (assumed) | Added spend at target CAC |
|---|---|---|---|---|
| 20 | 10% | 2 | R$ 300 / day | R$ 18,000 / month |
| 40 | 10% | 4 | R$ 300 / day | R$ 36,000 / month |
| 60 | 10% | 6 | R$ 300 / day | R$ 54,000 / month |
| 80 | 10% | 8 | R$ 300 / day | R$ 72,000 / month |
The math. 20 concepts × 10% = 2 winners × R$ 300 × 30 days = R$ 18,000 a month; 40 concepts × 10% = 4 winners × R$ 300 × 30 days = R$ 36,000 a month; 60 concepts × 10% = 6 winners × R$ 300 × 30 days = R$ 54,000 a month; 80 concepts × 10% = 8 winners × R$ 300 × 30 days = R$ 72,000 a month.
The hit rate and the spend each winner holds are placeholders. The first thirty days of tests replace them with real numbers, and the table is recalculated the same day.
07 Allocation
R$ 100,000 split four ways, led by Meta
- Meta tests and scaling of winning ads
- R$ 55,000
- 55%
- Creator pay and product seeding
- R$ 20,000
- 20%
- Landing pages and offer tests
- R$ 15,000
- 15%
- Reserve for winners that beat R$ 18.72
- R$ 10,000
- 10%
The R$ 100,000 is Proposed; the split moves toward whichever line holds CAC at R$ 18.72 once week one's data is in.
The math. 55% × R$ 100,000 = R$ 55,000; 20% × R$ 100,000 = R$ 20,000; 15% × R$ 100,000 = R$ 15,000; 10% × R$ 100,000 = R$ 10,000. Sum 100% = R$ 100,000.
This split is a proposal. It moves toward scaling as winners prove out, and toward testing when fatigue shows.
08 Channels
Meta first; four more channels open only on proof
| Channel | Open when (proposed) | Why wait |
|---|---|---|
| Meta | Week one, with the first 12 ads. | Short desk-setup demos of the Analog Card System fit feed video. |
| TikTok | When 10 creators are live by week six and hooks hold on Meta. | Creator clips of a Daily Focus Kit morning plan can run natively. |
| YouTube | When Meta CAC holds at R$ 18.72 for two weeks. | Longer walk-throughs suit the Discbound Heirloom Journal. |
| After the Analog and Journal landing pages are live. | Desk imagery suits it; card sleeves come in Bright, Earth and Monochromatic. | |
| Google Search | When branded searches for Ugmonk start to rise. | It catches people who saw the creator videos and then look for Ugmonk. |
A channel opens when its condition is true, not when the calendar says so. Until then the budget stays where the CAC is earned.
09 Payback
Payback decides: a R$ 20 CAC still pays back on repeat orders
Payback is the real constraint. At CAC R$ 10 the first order pays back, R$ 21.20 left. At R$ 20 it pays back after repeat orders, R$ 11.20 left. At R$ 35 or R$ 45 it never does: stop, −R$ 3.80 and −R$ 13.80 left. I have not seen Ugmonk's repeat data.
Cumulative margin per customer, order by order, before CAC: R$ 15.60, R$ 31.20.
| CAC (scenario) | First-order margin | Year-one margin | Left after CAC | Payback |
|---|---|---|---|---|
| R$ 10 | R$ 15.60 | R$ 31.20 | R$ 21.20 | First order |
| R$ 20 | R$ 15.60 | R$ 31.20 | R$ 11.20 | After repeat orders |
| R$ 35 | R$ 15.60 | R$ 31.20 | −R$ 3.80 | Never: stop |
| R$ 45 | R$ 15.60 | R$ 31.20 | −R$ 13.80 | Never: stop |
The math. CAC R$ 10: R$ 31.20 − R$ 10 = R$ 21.20 left; pays back: First order; CAC R$ 20: R$ 31.20 − R$ 20 = R$ 11.20 left; pays back: After repeat orders; CAC R$ 35: R$ 31.20 − R$ 35 = −R$ 3.80 left; pays back: Never: stop; CAC R$ 45: R$ 31.20 − R$ 45 = −R$ 13.80 left; pays back: Never: stop.
Read each row left to right: the margin of the first purchase, the margin over the whole horizon, what is left after CAC, and the purchase on which the CAC is earned back. A scenario that never pays back is a stop, not a test.
10 Scope
What I cover for Ugmonk, and what I don't
Covers
- Meta creative strategy and weekly experiments on Ugmonk products
- Creator recruiting and briefs for planners and journaling makers
- Landing page briefs for the Analog and Journal lines
- Daily CAC and monthly cohort payback reporting
Doesn’t
- Event tracking build: I spec it, your team implements it
- Product, pricing and shipping decisions
- Warehouse stock and returns handling
- Any claim Ugmonk's own pages don't make
What this plan covers is what I can change inside the ad account and the creator program. Everything outside it is named on the right so nobody assumes it is handled.
Gates, written before spend, so stopping isn’t a negotiation.
| Day | Keep going if (proposed) | Stop or change if |
|---|---|---|
| Day 14 | Twelve ads a week are live and at least one concept lands under R$ 18.72 CAC. | No concept near R$ 31.20 after R$ 6,000 of tests. |
| Day 30 | A winner holds R$ 18.72 CAC as spend rises, with eight creators live. | CAC above R$ 31.20 on every scaled ad. |
| Day 60 | Blended CAC across scaled ads holds at R$ 18.72 or better. | CAC above R$ 31.20 for two straight weeks. |
| Day 90 | Cohort payback shows repeat orders cover CAC, as the R$ 20 scenario needs. | Payback never arrives, as in the R$ 35 scenario. |
Each gate is checked on its day with the numbers in the daily and weekly reports. If the stop condition is true, the spend stops and nothing renews until we talk.
What exists, what’s missing, and the order that’s forced.
| Piece | Exists today | Missing | Forced order |
|---|---|---|---|
| claims sheet | Own wording: Free US Shipping, 4.9 Based on 61 Reviews | One approved claim per product line | Week 1 |
| creative | Photos of the Daily Focus Kit, journals and sleeves | Ad concepts built per product line | 1st |
| creators | Analog Card System used by 50,000+ people | Creator roster and briefs still to build | 2nd |
| landing pages | Product pages from R$ 13.00 cards up to journals | Ad-specific pages for Analog and Journal | 2nd |
| reporting | A 61 reviews page to benchmark proof against | Daily CAC and cohort payback by product | Week 1 |
The order is forced on purpose: creative and creators come first because they are what moves CAC, and everything else waits for that data.
Every number, and where it came from.
| Figure | Where it came from | Type |
|---|---|---|
| 50,000+ people use the Analog Card System | https://ugmonk.com/en-br | Fact |
| 61 reviews behind a 4.9 rating on one page | https://ugmonk.com/en-br/products/discbound-journal-bundle-standard-6x-8-5-journal | Fact |
| 2008 year Ugmonk began designing in Pennsylvania | https://ugmonk.com/en-br | Fact |
| Product prices R$ 6.95–R$ 449.00 | product prices in the site product data (143 products), read 2026-10-03 | Fact |
| R$ 39 average order · 40% margin · 1 repeat order | Placeholders, replaced in week one | Assumed |
| R$ 18.72 target CAC | 0.6 of the R$ 31.20 margin per customer | Calculated |
| R$ 31.20 margin per customer | Price × (margin − discount), summed over the orders | Calculated |
| R$ 24,000 of tests (96 ads × R$ 250) | Danilo’s plan, matches Month one | Calculated |
| 0→10 creators in 6 weeks · 7 videos per creator a week | Danilo’s plan, matches Month one and the Creator engine | Proposed |
| R$ 100,000 first budget split 55% / 20% / 15% / 10% | Danilo’s plan, re-set with the team in week one | Calculated |
| 10% hit rate · R$ 300 a day per winner | Placeholders, replaced by the first 30 days of tests | Assumed |
| 303 creator videos a month at 10 creators | 10 creators × 7 videos a week × 52 ÷ 12 | Calculated |
| R$ 5.74 per 1,000 views against a R$ 1 target | Creator cost over the views the assumptions give | Calculated |
| R$ 1,000 base pay · R$ 50 bonus past 100,000 views | Danilo’s plan | Proposed |
| 1,500 median views · 4% breakout (10×) · 0.5% viral (750,000) | Placeholders, replaced by the first month of posts | Assumed |
| Pay bands R$ 300–R$ 600, R$ 500–R$ 1,000, R$ 800–R$ 1,500 | Danilo’s plan | Proposed |
Every figure on this page is listed here with where it came from. Fact means read on the site. Assumed and Proposed are Danilo’s own numbers, to be replaced in week one. Calculated is plain arithmetic on those, with the formula shown next to it.
Month one is where it starts.
Week one: I go through your order data with your team, swap my R$ 39 guess for your real average order, and spec the purchase events. Then the first 12 ads go live on Meta, built from the Daily Focus Kit and the journals. Proposed.